Analyzing Reddit Submission Times
I enjoy reading the Data is Beautiful sub-Reddit, which often has interesting and useful visualizations. The official guide has some tips for making a great post, including this one:
The best time to post is generally between 12pm and 5pm EST (UTC–5). Other times also work well, but most of the successful posts on /r/dataisbeautiful were posted in that time range.
I thought I'd test that assertion. So I wrote a simple tool in Clojure and gnuplot that queries the Reddit API for a particular subreddit, groups recent submissions by the submission hour (UTC), and creates a chart displaying the percentage of high-scoring submissions per hour. Here's the current chart for DataIsBeautiful:
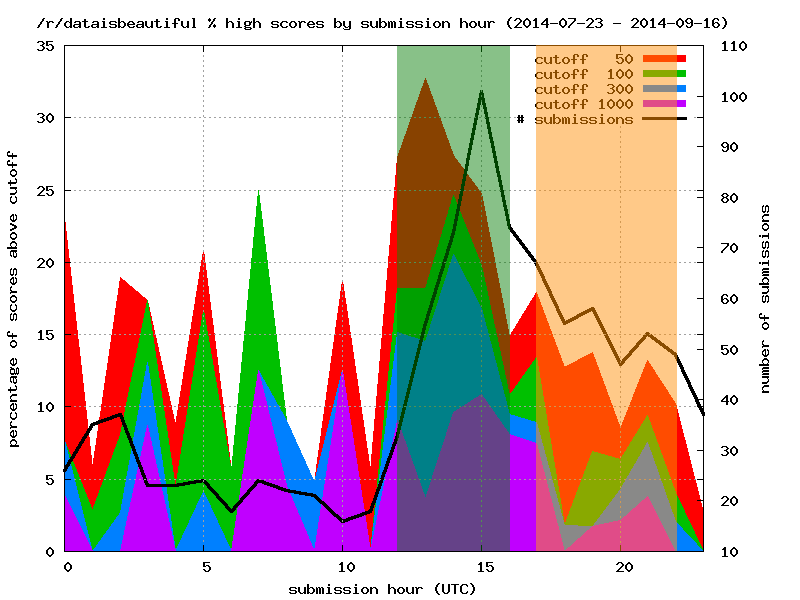
As you can see, the guide, highlighted in orange, was wrong! The best time to post, at least according to recent data, is actually between 8am and 12pm EDT (UTC–4), which is highlighted in green.
You can run the same analysis yourself on any subreddit by using the tool I wrote. Pull requests welcome!
Update 2014-09-16 2:07 PM
The Data is Beautiful sub-Reddit has updated their guide to reflect the new data. Cheers!